The FTIR (Fourier-Transform Infrared) microscope allows us to exploit the “fingerprint” nature of infrared spectra when examining microscopic samples. The FTIR microscopes can be widely used in scientific research, in the pharmaceutical industry, in materials science, environmental testing, quality control, forensic science and in the fight against counterfeiting. The measured spectra are suitable for molecular analysis of materials, for the identification of microplastics and contaminants of unknown origin and for the examination of coatings and biological samples, etc.
IRT-5X
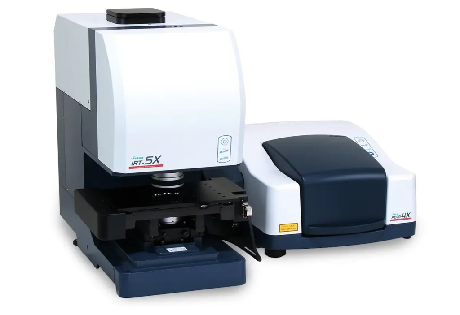
In the development of the IRT-5X FTIR microscope, introduced in 2025, built on the excellent optical properties of the IRT-5000/7000 instruments, numerous useful innovations were introduced to make the hardware and software use extremely convenient. The microscopes are controlled by the advanced Spectra Manager 2.5 software package, which also controls all the JASCO spectroscopic instruments. The IRT-5X, in its standard configuration, is suitable for transmission and reflection measurements, but with optional objectives it is also possible to perform ATR (Attenuated Total Reflection), RAS (Reflection Absorption Spectroscopy) and polarization measurements.
The IRT-5X FTIR microscope uses the light source and interferometer of the JASCO FT/IR spectrometer, but it has its own detector. The standard mid-band MCT detector can be used within the 7800 – 550 cm-1 wavenumber range. As a novelty, a pair of mid-band and narrow-band MCT detectors placed in the same Dewar vessel is available. The latter has a narrower wavenumber range (7800-750 cm-1), but much better sensitivity, and with the use of 32x magnification objectives, excellent quality spectra of very small samples can be obtained.
 The samples can be placed into the measuring position and focus by using the software-controlled autostage; the excellent quality and speed of the measurement and observation are supported by the auto-focus, auto-brightness and electronically driven iris mechanism functions. For observation and measurement, the objectives can be placed in a 4-position software-controlled revolver, and the condenser lenses required for transmission measurements can be replaced manually with a simple sliding mechanism.
 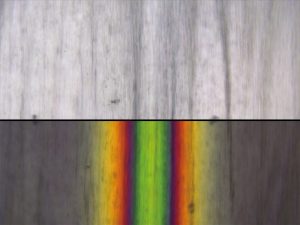 The IQ Monitor system provides the simultaneous visible image display and spectrum measurement. The latter is possible not only in transmission and reflection modes, but also when using Clear-View ATR objectives for ATR measurements. The built-in 5M pixel CMOS camera displays first-class microscopic images on the computer screen, which can be recorded in a data file together with the measured spectrum. Polarization observation can also be added due to which the structural changes of plastics, polymers and fabrics under the influence of stretching force can be followed. ATR measurements are also made faster by the IQ Mapping function, which allows more precise images of a given surface to be taken without moving the sample and the stage.
Specifications:
- Compatible FTIR instruments: JASCO FT/IR-4X, FT/IR-6X, FT/IR-8X
- Light source, interferometer: included in the FTIR instrument
- Measurement modes: transmission, reflection, ATR
- Detector:
- Standard: mid-band MCT detector (7800-550 cm-1)
- Optional:
- IQ Duo detector (7800-550 cm-1 (mid), 7800-750 cm-1 (narrow))
- DLATGS detector (7800-400 cm-1)
- InGaAs detector (12000-4000 cm-1)
- Signal/noise: 12000:1 (peak-to-peak, 100 x 100 µm, 4 cm-1, 1 min, around 2200 cm-1)
- Monitoring: IQ Monitor (simultaneous sample measurement and monitoring), 5 MP CMOS camera, high-intensity LED with auto-brightness function
- Cassegrain objectives:
- standard: 16x
- optional: 10x, 32x, diamond and germanium ATR
- stage: automatic, with autofocus
- movement: X: 100 mm, Y: 75 mm, Z: 30 mm (1 µm step)
- maximum load: 1kg
- max sample thickness in standard configuration 20 mm, can be increased to 40 mm in case of reflection measurements
- built-in pressure sensor
- dimensions: 565(H) × 350(W) × 610(D) mm, 53 kg
Spectra Manager 2.5
The Spectra Manager 2.5, which also controls both the JASCO FT/IR spectrometers and the IRT microscopes, provides automatic switching between the measurement modes of the FTIR spectrometer and the FTIR microscope. The software package includes all the functions that can be used to control the instruments: measurement parameters, measurement area selection, focus, stage movement, mapping measurements, etc. During the measurements, the image of the measured surface transmitted by the CMOS camera and the registered spectrum can be simultaneously viewed and recorded. The analysis section contains the mathematical functions necessary for the evaluation and processing of the spectra, extended with the functions necessary for the processing of the measurement results obtained during mapping measurements.
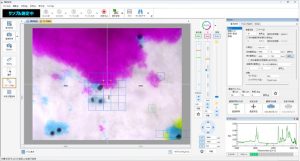 The measurement and evaluation software includes several extremely useful functions that make the JASCO FT/IR-5X easy to use and truly user-friendly. The IQ IR NAV module, with its image processing technology, can recognize the measurement targets from the observation image in real time, can register the coordinates and perform the measurements.
The IR Advanced Search NAV allows the specification of special conditions, which can be used to select particles of relevant size, shape and color for measurement. During the measurement, samples can be identified immediately if appropriate spectrum libraries exist.
Particle Analysis can perform various size measurements based on the observation image and spectrum information. This program includes statistical processing, which can be used to display particle size histograms, frequency and correlation distributions, and component ratios.